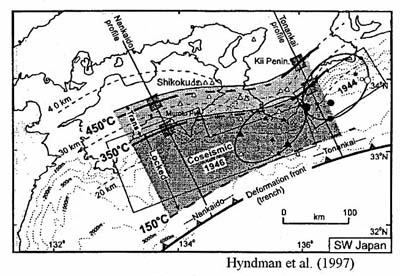
Fig.10 The Southwest Japan margin showing a comparison of the 150℃,350℃ and 450℃ isotherms with the coseismic rupture area for the 1946 and 1944 great earthquakes and the interseismic locked zone (dark shaded) and transition zone (light shaded) from dislocation modelling if gerdetic data (after Hyndman et al.1995). The solid line boxes are the coseismic rupture areas from Kanamori (1972) and Ando(1975,1982). The filled square symboles are the 1-day aftershocks and the open square symbols are the 1-month aftershocks. The depth contours are to the subduction thrust fault. The two straight solid lines mark the Nankaido and Tonankai two-dimensional thermal model profiles and the shaded boxes mark the estimated position uncertainties for the critical temperatures.