B. GPSデータから推定されるバックスリップの分布 (石橋モデルの断層投影範囲より西の、遠州灘海域にバックスリップ量の大きな領域が広がる。)
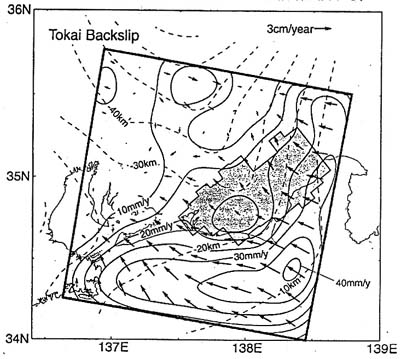
Figure 3. Distribution of the back-slip in the Tokai district. Arrows and solid contours represent both direction and magnitude of back-slip at each point on the plate boundary. Dashed lines show depth contours of plate boundary configuration. Shaded area is Matsumura"s [1997] locked zone estimated from seismicity data.
Sagiya,T.(1999) Interplate coupling in the Tokai District, Central Japan,deducedfrom continuous GPS data. Geophys. Res.Lett. ,26, p.2315-2318.