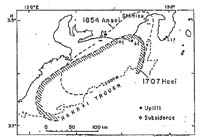
Fig. 20. Source areaa of the 1707 Hoei and the 1854 Ansei tsunami inferred from the seismic, tsunami and geodetic data.
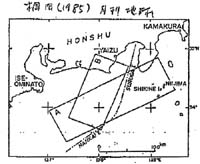
図4 1498年明応地震の初めの断層モデルAを見直したモデルB。
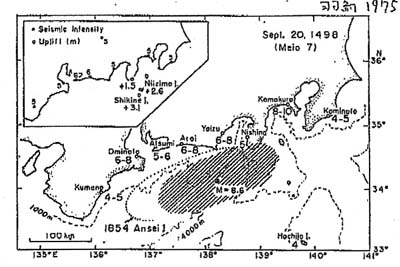
明応地震
Fig.1. Distribution of the inundation heights (unit:m) inferred from old documents and the hypothetical source area of the 1498 Meio tsunami. Upper left figure : Distribution of seismic intensity (JMA scale) and uplift inferred from the remains of ancient boring shells (Fukutomi,1935)
図1
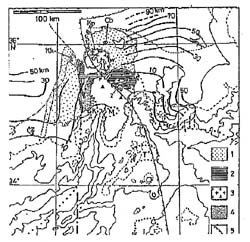
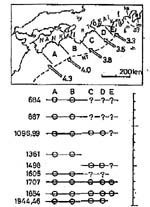
Figure 21,space-time distribution of great earthquakes along the Nankai - Suruga trough. White arrows with numerals (in cm/year) in the upper figure repreaent slip vectors of relative motion between the philippine sea and the Eurasian plates calculated by seno [1997]. Bars with circles show ranges of rupture zones of great earthquakes, NT, nankai.trough; ST, Sagami trough; B, Boso Feninsula; f, Mt.Fuji; h, Hachijo Island; ka, Kamakura; s, Shikine Island; y, Yaizu.